Reagan‑era iceberg A‑23A breaking apart after 40‑year odyssey, scientists say days from collapse
Iceberg A‑23A, a tabular berg that calved in 1986, is rapidly fragmenting in the warmer South Atlantic after a 40‑year journey; scientists report extensive blue meltwater pools and expect full breakup within days to weeks.
- Long life: Calved in 1986 from the Filchner–Ronne Ice Shelf and remained a grounded “megaberg” for decades.
- Rapid decline: Area down from ~4,000 km² to ~1,182 km² (456 sq mi) as of early January 2026, per the U.S. National Ice Center iceberg products.
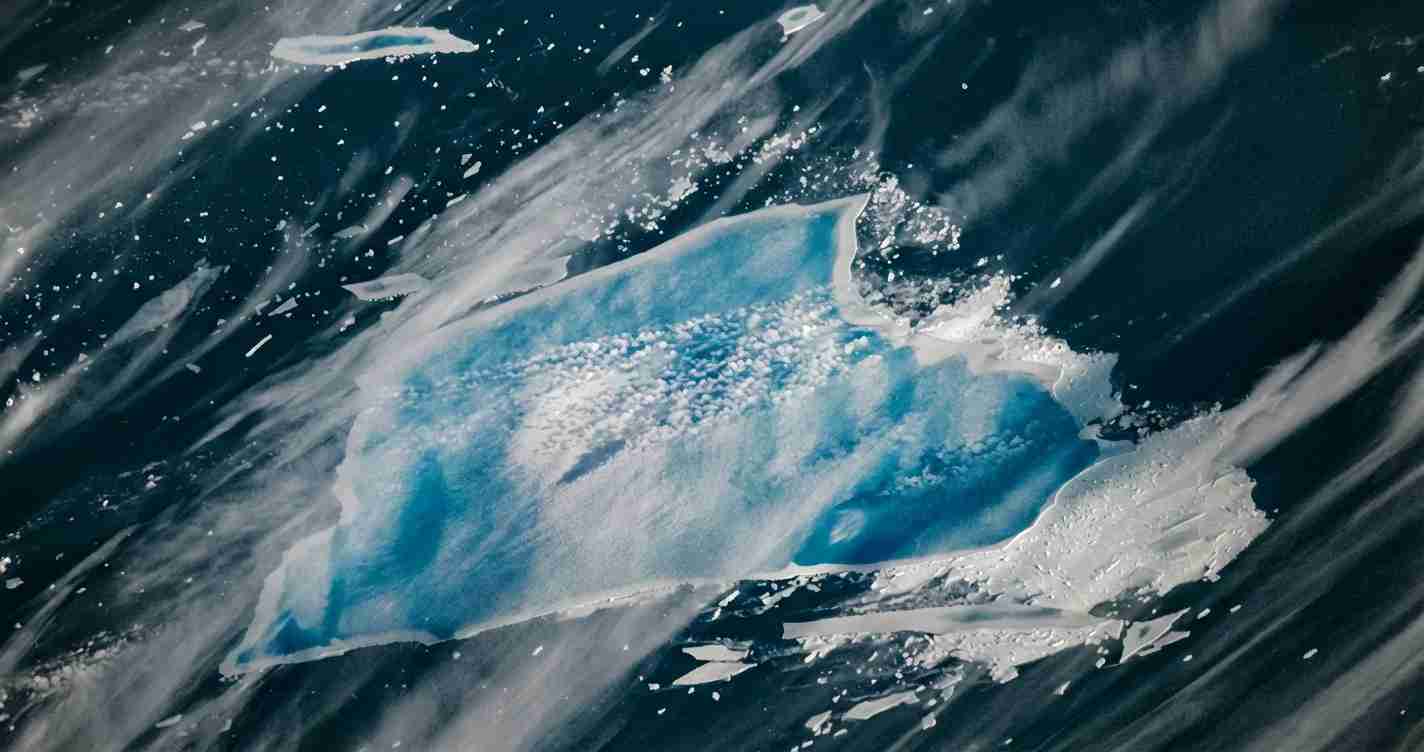
- Visible weakening: High‑resolution imagery shows extensive bright blue meltwater pools and zones described as “blue mush” (see NASA Earth Observatory: Meltwater turns iceberg A‑23A blue).
- Scientific value & hazard: Decades of study yield rare data on megaberg behavior while fragments pose shipping risks monitored by NIC and maritime agencies.
Origin and Reagan‑era iceberg history
Iceberg A‑23A calved from the Filchner–Ronne Ice Shelf in the Weddell Sea in 1986, during President Ronald Reagan’s administration — a detail commonly referenced in media as its “Reagan‑era” origin. At roughly ~4,000 km² when it broke free, it was among the world’s largest tabular icebergs and drew scientific and logistical attention. Portions of the ice that formed A‑23A once hosted a Soviet field station that was removed and relocated when the berg calved (see the A‑23A Wikipedia entry and the NASA Earth Observatory report).
Decades stuck in the Weddell Sea
After calving, A‑23A became grounded on shallow seabed features in the Weddell Sea. That grounding kept the iceberg largely in place for more than 30 years, producing gradual basal melting and slow edge erosion but little large‑scale drift. This prolonged stationary phase is why scientists classify it as a “megaberg” — a massive iceberg capable of living for decades (British Antarctic Survey media release).
Release, renewed motion and scientific sampling
Around 2020 A‑23A finally broke free from the seabed. By late 2023 it was moving north past the Antarctic Peninsula into open Southern Ocean waters. Researchers aboard the British icebreaker RRS Sir David Attenborough conducted sampling and observations; in December 2023 the British Antarctic Survey collected water and biological samples to study how iceberg meltwater alters surface chemistry and fuels plankton.
Taylor column trap and unusual spin
In early 2024 A‑23A became caught in a Taylor column — a rotating ocean flow above the Pirie Bank seamount — which trapped and spun the iceberg in place. Satellite analyses showed the berg rotating at roughly 15° per day while remaining nearly stationary, a stalled phase that delayed its northward journey into warmer seas (EUMETSAT case study).
Passage toward South Georgia and fragmentation
By early 2025 A‑23A had escaped the Taylor column and drifted toward the South Atlantic and the sub‑Antarctic island of South Georgia — a region long known as a “graveyard” for large icebergs because warmer currents and shallow features promote rapid breakup. During 2025 several large pieces separated (July–September) and by late 2025–early 2026 multiple sizeable fragments were tracked by satellite imagery (NASA; Wikipedia).
Size evolution and the NIC estimate
A‑23A’s area has shrunk from about 4,000 km² at calving to an estimated ~1,182 km² (456 sq mi) as of early January 2026, according to the U.S. National Ice Center iceberg products. That represents a loss of roughly 70% of the original area, yet it remains larger than many major cities — NASA notes it is still larger than New York City (NASA Earth Observatory).
Blue meltwater pools, “blue mush” and structural weakening
High‑resolution MODIS satellite images from late December 2025 show extensive bright blue meltwater pools across A‑23A’s surface. These pools form when surface snow and ice melt and collect in depressions; they appear in satellite imagery as bright blue patches. Scientists, including Ted Scambos of the University of Colorado Boulder, describe partly disintegrated areas as “blue mush.”
“Meltwater forces open fissures, adds weight, and can punch through the berg’s side in blowouts that send freshwater plumes into the ocean,” — observed in recent analyses (see NASA Earth Observatory).
These processes accelerate calving and signal imminent collapse as the berg drifts into ~3°C waters where it now resides.
Why A‑23A matters to science and shipping
A‑23A offers a rare long‑term case study: its history illustrates grounding, decades of slow change, escape, entrapment in ocean currents, and rapid disintegration. Samples collected in 2023 will help researchers understand how iceberg meltwater delivers freshwater, nutrients and mineral dust that can stimulate ocean productivity. At the same time, fragmentation scattered large pieces across shipping routes in 2025; the NIC and maritime agencies continue monitoring for navigational hazards.
Implications for Sonoma, California
Economic impact: Sonoma County is far from the South Atlantic, so A‑23A’s breakup will not cause direct economic damage here. Yet local scientists, educators and research institutions may benefit from new data and images for climate education and outreach. Regional ports and shipping lanes that support wine and agricultural exports are not directly threatened, though global shipping patterns and costs can shift if long ocean routes are affected by iceberg hazards tracked by NIC.
Political consequences: For moderate voters in Sonoma, the story underscores the practical side of climate and ocean policy — a data‑driven, non‑partisan angle that local officials can use to press for research funding and coastal resilience planning.
Social and cultural effects: The dramatic 40‑year saga is a teaching moment for schools and community groups. Satellite photos and NASA resources can help explain iceberg formation, why meltwater pools matter, and how distant polar events connect to global systems that affect local weather and fisheries. Sonoma’s stewardship culture may find the visuals especially resonant.
Practical applications: Local researchers and citizen scientists can incorporate A‑23A data into curricula, public lectures and coastal monitoring. Regional planners can cite monitored decline as part of evidence for investing in coastal resilience, water management and partnerships with oceanographic research institutions.
Sources and further reading
- NASA Earth Observatory: Meltwater turns iceberg A‑23A blue
- U.S. National Ice Center iceberg products
- British Antarctic Survey media release on A‑23A
- EUMETSAT case study: Iceberg A23‑A through the decades
- A‑23A entry on Wikipedia (compiled data)
- NOAA NESDIS tracking summary
For NIC position and dimension updates, consult the U.S. National Ice Center iceberg products. For imagery and analysis of meltwater features, see the NASA Earth Observatory.